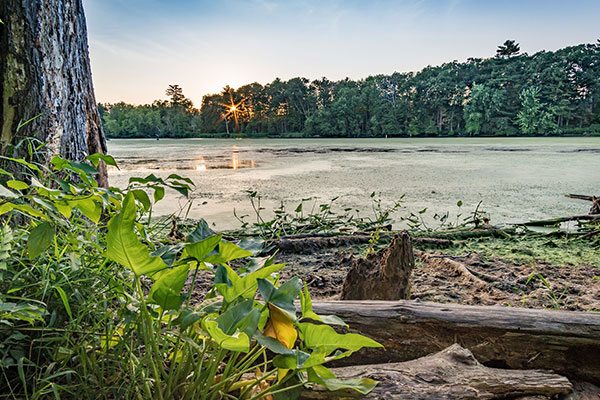
Florida is the Fishing Capital of the World — and Lake Okeechobee is a huge part of the reason.
Sometimes referred to as Florida’s Inland Sea or The Big “O”, Lake Okeechobee is the largest freshwater lake in Florida and the second largest lake on the continental United States.
With a size of over 730 square miles and with 135 miles of shoreline, the lake is approximately half the size of the state of Rhode Island. Lake Okeechobee is central to a region of Florida historically known for its agriculture, but in recent times also equated with superior fishing, boating and trails. The Lake is conveniently located in the middle of the state, about 40 miles northwest of West Palm Beach, granting easy access to residents and visitors from all over the state. Small towns, orange groves, sugarcane fields, and waterways decorate the flatlands surrounding the 35-foot-high Herbert Hoover Dike, which was built around Okeechobee in 1928 to protect against flooding.
The 152-mile Okeechobee Waterway bisects the lake, and Florida itself, allowing boats to cut across, rather than sail around. Millions of Largemouth Bass inhabit the huge lake, and it has been called the “Black Bass Capital of the World.” The lake is divided between Glades, Okeechobee, Martin, Palm Beach, and Hendry counties. All five counties meet at one point near the center of the lake. Freshwater fishing retail sales in the five counties surrounding Lake Okeechobee were estimated at more than $117 million during 2000.
The following information is a sample of the state. For further analysis, visit the U.S. Census Quickfacts Website.
| Population |
Florida
|
|---|---|
| Population estimates, July 1, 2017, (V2017) | 20,984,400 |
| Population estimates, July 1, 2016, (V2016) | 20,612,439 |
| Population estimates base, April 1, 2010, (V2017) | 18,804,594 |
| Population estimates base, April 1, 2010, (V2016) | 18,804,592 |
| Population, percent change – April 1, 2010 (estimates base) to July 1, 2017, (V2017) | 11.6% |
| Population, percent change – April 1, 2010 (estimates base) to July 1, 2016, (V2016) | 9.6% |
| Population, Census, April 1, 2010 | 18,801,310 |
| Age and Sex | |
| Persons under 5 years, percent, July 1, 2016, (V2016) | 5.5% |
| Persons under 5 years, percent, April 1, 2010 | 5.7% |
| Persons under 18 years, percent, July 1, 2016, (V2016) | 20.1% |
| Persons under 18 years, percent, April 1, 2010 | 21.3% |
| Persons 65 years and over, percent, July 1, 2016, (V2016) | 19.9% |
| Persons 65 years and over, percent, April 1, 2010 | 17.3% |
| Female persons, percent, July 1, 2016, (V2016) | 51.1% |
| Female persons, percent, April 1, 2010 | 51.1% |
| Race and Hispanic Origin | |
| White alone, percent, July 1, 2016, (V2016)(a) | 77.6% |
| Black or African American alone, percent, July 1, 2016, (V2016)(a) | 16.8% |
| American Indian and Alaska Native alone, percent, July 1, 2016, (V2016)(a) | 0.5% |
| Asian alone, percent, July 1, 2016, (V2016)(a) | 2.9% |
| Native Hawaiian and Other Pacific Islander alone, percent, July 1, 2016, (V2016)(a) | 0.1% |
| Two or More Races, percent, July 1, 2016, (V2016) | 2.1% |
| Hispanic or Latino, percent, July 1, 2016, (V2016)(b) | 24.9% |
| White alone, not Hispanic or Latino, percent, July 1, 2016, (V2016) | 54.9% |
| Population Characteristics | |
| Veterans, 2012-2016 | 1,480,133 |
| Foreign born persons, percent, 2012-2016 | 19.9% |
| Housing | |
| Housing units, July 1, 2016, (V2016) | 9,301,642 |
| Housing units, April 1, 2010 | 8,989,580 |
| Owner-occupied housing unit rate, 2012-2016 | 64.8% |
| Median value of owner-occupied housing units, 2012-2016 | $166,800 |
| Median selected monthly owner costs -with a mortgage, 2012-2016 | $1,422 |
| Median selected monthly owner costs -without a mortgage, 2012-2016 | $466 |
| Median gross rent, 2012-2016 | $1,032 |
| Building permits, 2016 | 116,240 |
| Families & Living Arrangements | |
| Households, 2012-2016 | 7,393,262 |
| Persons per household, 2012-2016 | 2.64 |
| Living in same house 1 year ago, percent of persons age 1 year+, 2012-2016 | 83.9% |
| Language other than English spoken at home, percent of persons age 5 years+, 2012-2016 | 28.3% |
| Education | |
| High school graduate or higher, percent of persons age 25 years+, 2012-2016 | 87.2% |
| Bachelor’s degree or higher, percent of persons age 25 years+, 2012-2016 | 27.9% |
| Health | |
| With a disability, under age 65 years, percent, 2012-2016 | 8.6% |
| Persons without health insurance, under age 65 years, percent |
16.2% |
| Economy | |
| In civilian labor force, total, percent of population age 16 years+, 2012-2016 | 58.5% |
| In civilian labor force, female, percent of population age 16 years+, 2012-2016 | 54.3% |
| Total accommodation and food services sales, 2012 ($1,000)(c) | 49,817,925 |
| Total health care and social assistance receipts/revenue, 2012 ($1,000)(c) | 124,061,425 |
| Total manufacturers shipments, 2012 ($1,000)(c) | 96,924,106 |
| Total merchant wholesaler sales, 2012 ($1,000)(c) | 252,626,608 |
| Total retail sales, 2012 ($1,000)(c) | 273,867,145 |
| Total retail sales per capita, 2012(c) | $14,177 |
| Transportation | |
| Mean travel time to work (minutes), workers age 16 years+, 2012-2016 | 26.7 |
| Income & Poverty | |
| Median household income (in 2016 dollars), 2012-2016 | $48,900 |
| Per capita income in past 12 months (in 2016 dollars), 2012-2016 | $27,598 |
| Persons in poverty, percent |
14.7% |
| Businesses | |
|---|---|
| Total employer establishments, 2015 | 532,8301 |
| Total employment, 2015 | 7,777,9901 |
| Total annual payroll, 2015 ($1,000) | 337,074,5251 |
| Total employment, percent change, 2014-2015 | 4.5%1 |
| Total nonemployer establishments, 2015 | 2,040,339 |
| All firms, 2012 | 2,100,187 |
| Men-owned firms, 2012 | 1,084,885 |
| Women-owned firms, 2012 | 807,817 |
| Minority-owned firms, 2012 | 926,112 |
| Nonminority-owned firms, 2012 | 1,121,749 |
| Veteran-owned firms, 2012 | 185,756 |
| Nonveteran-owned firms, 2012 | 1,846,686 |
| Geography | |
|---|---|
| Population per square mile, 2010 | 350.6 |
| Land area in square miles, 2010 | 53,624.76 |
| FIPS Code | 12 |

