
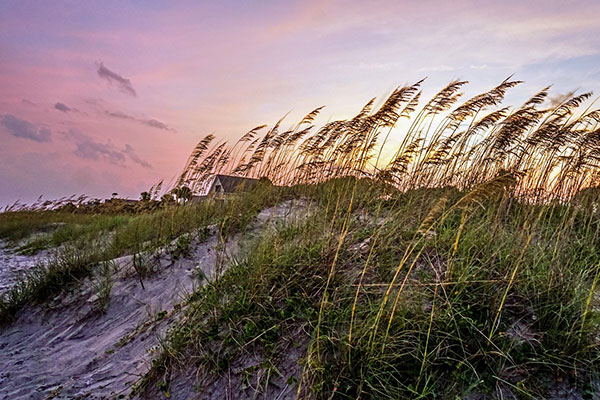
Hilton Head/Lowcountry – South of Charleston and north of Savannah, The Lowcountry region of South Carolina beckons beach lovers, thrill seekers, history buffs, outdoor enthusiasts, bird watchers, foodies, fishermen, golfers, artists and authors with its laidback lifestyle, lush landscapes, natural attractions and diverse culture. Today, this region is known for its historic cities and communities, beautiful natural environment, cultural heritage, and strong tourism industry.
With over 300 square miles of marshland waters, you’ll find no better place for fly fishing than in the flats and backwaters of the South Carolina Lowcountry. On Hilton Head Island, you can choose from fishing in fresh and brackish water lagoons, tidal lagoons, estuaries (tidal creeks), inshore on the Calibogue Sound and offshore in the Atlantic ocean.
The island features 12 miles of beachfront and is a popular vacation destination. In 2004, an estimated 2.25 million visitors pumped more than $1.5 billion into the local economy.
The following information is a sample of the state census. For further analysis, visit the U.S. Census Quickfacts Website.
| Population |
South Carolina
|
|---|---|
| Population estimates, July 1, 2017, (V2017) | 5,024,369 |
| Population estimates, July 1, 2016, (V2016) | 4,961,119 |
| Population estimates base, April 1, 2010, (V2017) | 4,625,381 |
| Population estimates base, April 1, 2010, (V2016) | 4,625,410 |
| Population, percent change – April 1, 2010 (estimates base) to July 1, 2017, (V2017) | 8.6% |
| Population, percent change – April 1, 2010 (estimates base) to July 1, 2016, (V2016) | 7.3% |
| Population, Census, April 1, 2010 | 4,625,364 |
| Age and Sex | |
| Persons under 5 years, percent, July 1, 2016, (V2016) | 5.9% |
| Persons under 5 years, percent, April 1, 2010 | 6.5% |
| Persons under 18 years, percent, July 1, 2016, (V2016) | 22.1% |
| Persons under 18 years, percent, April 1, 2010 | 23.4% |
| Persons 65 years and over, percent, July 1, 2016, (V2016) | 16.7% |
| Persons 65 years and over, percent, April 1, 2010 | 13.7% |
| Female persons, percent, July 1, 2016, (V2016) | 51.5% |
| Female persons, percent, April 1, 2010 | 51.4% |
| Race and Hispanic Origin | |
| White alone, percent, July 1, 2016, (V2016)(a) | 68.5% |
| Black or African American alone, percent, July 1, 2016, (V2016)(a) | 27.5% |
| American Indian and Alaska Native alone, percent, July 1, 2016, (V2016)(a) | 0.5% |
| Asian alone, percent, July 1, 2016, (V2016)(a) | 1.6% |
| Native Hawaiian and Other Pacific Islander alone, percent, July 1, 2016, (V2016)(a) | 0.1% |
| Two or More Races, percent, July 1, 2016, (V2016) | 1.8% |
| Hispanic or Latino, percent, July 1, 2016, (V2016)(b) | 5.5% |
| White alone, not Hispanic or Latino, percent, July 1, 2016, (V2016) | 63.9% |
| Population Characteristics | |
| Veterans, 2012-2016 | 373,890 |
| Foreign born persons, percent, 2012-2016 | 4.8% |
| Housing | |
| Housing units, July 1, 2016, (V2016) | 2,236,153 |
| Housing units, April 1, 2010 | 2,137,683 |
| Owner-occupied housing unit rate, 2012-2016 | 68.4% |
| Median value of owner-occupied housing units, 2012-2016 | $143,600 |
| Median selected monthly owner costs -with a mortgage, 2012-2016 | $1,185 |
| Median selected monthly owner costs -without a mortgage, 2012-2016 | $349 |
| Median gross rent, 2012-2016 | $811 |
| Building permits, 2016 | 32,165 |
| Families & Living Arrangements | |
| Households, 2012-2016 | 1,839,041 |
| Persons per household, 2012-2016 | 2.55 |
| Living in same house 1 year ago, percent of persons age 1 year+, 2012-2016 | 84.9% |
| Language other than English spoken at home, percent of persons age 5 years+, 2012-2016 | 6.9% |
| Education | |
| High school graduate or higher, percent of persons age 25 years+, 2012-2016 | 86.0% |
| Bachelor’s degree or higher, percent of persons age 25 years+, 2012-2016 | 26.5% |
| Health | |
| With a disability, under age 65 years, percent, 2012-2016 | 10.4% |
| Persons without health insurance, under age 65 years, percent |
12.9% |
| Economy | |
| In civilian labor force, total, percent of population age 16 years+, 2012-2016 | 60.0% |
| In civilian labor force, female, percent of population age 16 years+, 2012-2016 | 56.2% |
| Total accommodation and food services sales, 2012 ($1,000)(c) | 9,763,818 |
| Total health care and social assistance receipts/revenue, 2012 ($1,000)(c) | 22,941,292 |
| Total manufacturers shipments, 2012 ($1,000)(c) | 99,160,840 |
| Total merchant wholesaler sales, 2012 ($1,000)(c) | 45,520,900 |
| Total retail sales, 2012 ($1,000)(c) | 58,093,824 |
| Total retail sales per capita, 2012(c) | $12,298 |
| Transportation | |
| Mean travel time to work (minutes), workers age 16 years+, 2012-2016 | 24.1 |
| Income & Poverty | |
| Median household income (in 2016 dollars), 2012-2016 | $46,898 |
| Per capita income in past 12 months (in 2016 dollars), 2012-2016 | $25,521 |
| Persons in poverty, percent |
15.3% |
| Businesses | |
|---|---|
| Total employer establishments, 2015 | 103,9731 |
| Total employment, 2015 | 1,662,2511 |
| Total annual payroll, 2015 ($1,000) | 66,120,2631 |
| Total employment, percent change, 2014-2015 | 2.8%1 |
| Total nonemployer establishments, 2015 | 329,431 |
| All firms, 2012 | 367,726 |
| Men-owned firms, 2012 | 202,446 |
| Women-owned firms, 2012 | 131,856 |
| Minority-owned firms, 2012 | 83,233 |
| Nonminority-owned firms, 2012 | 276,269 |
| Veteran-owned firms, 2012 | 47,987 |
| Nonveteran-owned firms, 2012 | 303,137 |
| Geography | |
|---|---|
| Population per square mile, 2010 | 153.9 |
| Land area in square miles, 2010 | 30,060.70 |
| FIPS Code | 45 |